The Historical Automobile Sales Statistics Dashboard is a web-based tool created as part of the IBM Data Analyst Certification project. It allows users to visualize and analyze data related to automobile sales, advertising expenditure, and more.
Features
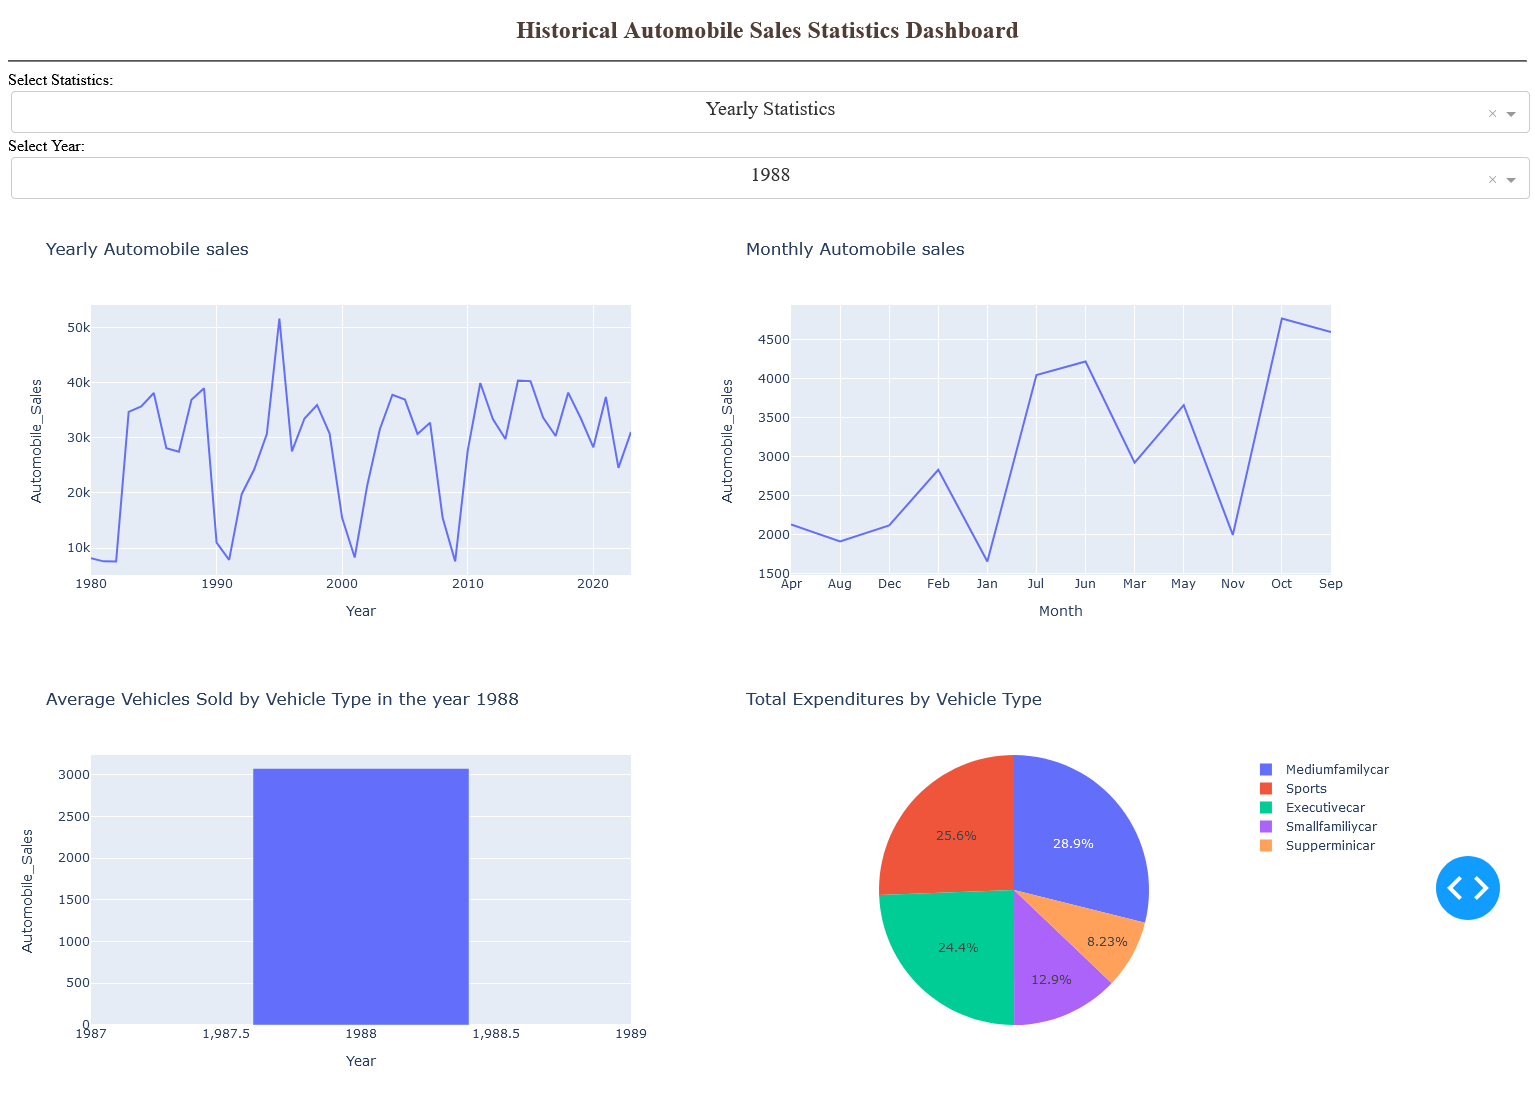
Yearly Statistics
- View trends in automobile sales for individual years.
- Analyze monthly sales patterns.
- Explore advertising expenditure by vehicle type.
Recession Period Statistics
- Analyze automobile sales performance during recession periods.
- Understand the correlation between sales, unemployment rate, and advertising expenditure.
- Visualize the impact of economic downturns on the automotive industry.
Technologies Used
The dashboard is built using Python and the Dash framework, which enables the creation of interactive web applications. Plotly Express is used for data visualization, allowing for the creation of interactive and customizable plots with ease. The dashboard leverages Pandas for data manipulation and analysis.
Conclusion
The Historical Automobile Sales Statistics Dashboard provides a comprehensive platform for exploring historical trends in automobile sales. By leveraging the power of data visualization and interactive dashboards, users can gain a deeper understanding of historical automobile sales trends and make informed decisions.